
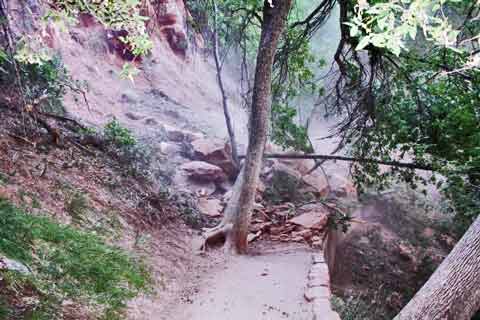
Is climate change reducing the size of Yosemite National Park's forests? Kurt Repanshek photo.
Climate change with its warmer and drier seasons appears to be responsible for a decline in large-diameter trees across much of Yosemite National Park, according to a recently released study. Published in the Forest Ecology and Management journal, the study (attached below) suggests that one way to perhaps strengthen the park's forests against climate change is to introduce more prescribed fires.
According to the research, Yosemite was home to more forests with large-diameter stands of Ponderosa pines, Incense cedars, White fir, Sugar pines, Jeffrey pines, Red fir, Western White pine, Lodgepole pine, Whitebark pine and Mountain Hemlock between 1932-1936 than during 1988-1999. The impact of this downsizing goes beyond beautiful vistas, as mature forests "moderate the local environment; serve as a seed source for the surrounding landscape; and withstand fires, climate variation and insect outbreaks that kill or weaken smaller-diameter trees," the authors note.
While the authors, who reached their conclusions after comparing the findings of a 1932-1936 study of tree densities with one from 1988-1999, acknowledge that there are "many alternative explanations for the decline in densities of large trees," they lean toward climate change in general and water stress specifically as the most likely cause. Other studies have pointed to a decline in Sierra snowpacks, which slowly release water as they melt through spring and on into the summer, and increased rainfall, which runs off much more quickly, as being linked to climate change.
Increased water stress -- whether arising from extrinsic climatic change or intrinsic changes in stand density -- we view as the leading candidate for the underlying cause of the recent doubling in mortality rates in old-growth forests throughout western North America, although the proximate causes of mortality may vary...
...The decline in large-diameter trees could accelerate as the climate in California becomes warmer by mid-century. A temperature increase – even without a decrease in precipitation – will increase evaporative demand, decrease snowpack, increase the length of the snow-free period, increase the length of the growing season, and thereby increase annual climatic water deficit. In addition, fires are expected to increase in number, start earlier, last longer, burn larger areas, and become more severe.
When climate changes rapidly compared to the centuries-long lifespan of trees, there is a shorter period of the optimum conditions in which to attain those large diameters. Increased water stress on sites where large-diameter trees are now present could lead to elevated mortality, but time is required for trees establishing on newly favourable sites to grow to large diameters. Therefore, when climate is changing rapidly, we should expect densities of large-diameter trees to be lower than in stable climatic conditions, whether they are warm or cold. The decrease in densities of large-diameter trees could, therefore, be an indicator of climate change that is beyond the recent natural range of variation in these forests.
Fire, via prescribed burns, could actually help the forests build up a resistance of sorts to climate change, they added, as stands of Ponderosa pine and Incense cedar that had experienced fires during the 20th century "retained large-diameter Ponderosa pine. Plots not experiencing 20th century fire had almost no large-diameter Ponderosa pine."
The bottom line, they noted, was that "our strong inference from this research is that the largest trees of most species in Yosemite are in decline. This decrease in large-diameter tree density throughout much of Yosemite can be interpreted as a long-term change in forest structure during the 20th century."
Story Categories:
A copy of National Parks Traveler's financial statements may be obtained by sending a stamped, self-addressed envelope to: National Parks Traveler, P.O. Box 980452, Park City, Utah 84098. National Parks Traveler was formed in the state of Utah for the purpose of informing and educating about national parks and protected areas.
Residents of the following states may obtain a copy of our financial and additional information as stated below:
- Florida: A COPY OF THE OFFICIAL REGISTRATION AND FINANCIAL INFORMATION FOR NATIONAL PARKS TRAVELER, (REGISTRATION NO. CH 51659), MAY BE OBTAINED FROM THE DIVISION OF CONSUMER SERVICES BY CALLING 800-435-7352 OR VISITING THEIR WEBSITE. REGISTRATION DOES NOT IMPLY ENDORSEMENT, APPROVAL, OR RECOMMENDATION BY THE STATE.
- Georgia: A full and fair description of the programs and financial statement summary of National Parks Traveler is available upon request at the office and phone number indicated above.
- Maryland: Documents and information submitted under the Maryland Solicitations Act are also available, for the cost of postage and copies, from the Secretary of State, State House, Annapolis, MD 21401 (410-974-5534).
- North Carolina: Financial information about this organization and a copy of its license are available from the State Solicitation Licensing Branch at 888-830-4989 or 919-807-2214. The license is not an endorsement by the State.
- Pennsylvania: The official registration and financial information of National Parks Traveler may be obtained from the Pennsylvania Department of State by calling 800-732-0999. Registration does not imply endorsement.
- Virginia: Financial statements are available from the Virginia Department of Agriculture and Consumer Services, 102 Governor Street, Richmond, Virginia 23219.
- Washington: National Parks Traveler is registered with Washington State’s Charities Program as required by law and additional information is available by calling 800-332-4483 or visiting www.sos.wa.gov/charities, or on file at Charities Division, Office of the Secretary of State, State of Washington, Olympia, WA 98504.
INN Member

The easiest way to explore RV-friendly National Park campgrounds.

Here’s the definitive guide to National Park System campgrounds where RVers can park their rigs.
Our app is packed with RVing- specific details on more than 250 campgrounds in more than 70 national parks.
You’ll also find stories about RVing in the parks, tips helpful if you’ve just recently become an RVer, and useful planning suggestions.

Comments
The other shoe is a pair of papers by van Mantgem et al. (Ecology Letters10:909-916 (2007); Science 323:521-524 (2009)) showing that from Sequoia NP to Yosemite NP, over the past 20-30 years, per tree per year mortality rates have roughly doubled (that's what's referenced in the first paragraph of your excerpt).
Part of increased mortality is _because_ there are more small trees (small trees die at much higher rates than big trees, and fire suppression lets many more saplings become small trees rather than being killed as seedlings & saplings), but part is less soil moisture to go around even if the densities stayed the same.
One sobering implication is that even with increased controlled burns (to thin the medium trees and thus reduce the competition for water), it will take centuries to get back to the numbers of large trees found even 100 years ago. And, even with shifts in species ranges (e.g., those central Sierra species growing by Lassen or into Oregon), there won't be really big trees. Locations with favorable climate when the tree is an establishing sedling & sapling won't still be favorable by the time the tree might get large.
Knowing that Climate Change affects each region differently, I wonder how tree diameters are being affected at our National Parks in the Cascade and Rocky Mtns? The Whitebark pines (a high-altitude tree species) and other five-needle pines within the parks of these mountain ranges are already being devastated by blister rust. Thanks Kurt.
rob mutch
---
Executive Director,
Crater Lake Institute
www.craterlakeinstitute.com
Robert Mutch Photography
Frank, I think you enjoy being a contrarian.
Google the study in question, under the "news" category, and see what you come up with. In other stories the scientists spoke specifically of climate change as a driver in what's going on. Do they say that it's solely responsible? No. It's one element, but a "likely" contributor nonetheless. And if you've spent any time reading these studies, you know that the scientists always couch their conclusions with qualifiers.
I've looked at more than a few peer-reviewed studies on climate change over the past year or so and have talked to more than a few experts in the field. That said, what's going on around the West are lower snowpacks due to more warming and more frequent rain-on-snow events. You shrink the snowpacks, you shrink the amount of water available for trees throughout the summer, when they most need it, as Dr. van Wagtendonk notes above.
Frank, not sure where you're getting your data, but here's some news from NOAA:
As for your contention that "2008 was wetter and cooler than many previous years," that doesn't appear to be the case if you look at NOAA's 2008 precipitation data, although temperature-wise some areas of the country certainly were colder than usual. But 2007 was drier than normal in many, if not most, parts of the country. Unfortunately, annual temperature data for the country are not available for 2007.
As for snowpack, here's what the National Climatic Data Center had to say in looking back at the winter of 2008-2009:
Global temperature trends for 2007 (and more) can be found at NASA's GISS Surface Temperature Analysis.
Locally there is the Rocky Mountain Climate Organization.
For some background (and beyond) read BEYOND THE IVORY TOWER: The Scientific Consensus on Climate Change by Naomi Oreskes
Naomi Oreskes 2007 essay (PDF) is a good read also..
Frank is right to point out that the Earth has gone through many natural climate fluctuations in the past 2000 years. However, there's one important variable he's not considering - the exponential growth of the human population. According to historical demographers, 2000 years ago there just weren't that many of us around to make a difference. At that time, global population was relatively stable at approximately 1/4 of a billion souls. Between 900 and 1300, the human population doubled. From 1900 to 2000, the lowering of the childbirth mortality rate and advances in medicine caused the number of humans to skyrocket; presently the global population is estimated to be 6.775 BILLION people! Now that's a lot of trash - I don't believe for one minute that the plastic island in the Pacific Gyre is a natural phenomenon.
It's undisputed that humans have altered the face of the Earth to satisfy the insatiable demand for fresh water, fuel, and food. So there just might be something more to say about this topic. The way I see it, Kurt wins by a mudslide!