Editor's note: Yellowstone Caldera Chronicles is a weekly column written by scientists and collaborators of the Yellowstone Volcano Observatory. This week's contribution is from Blaine McCleskey, research chemist with the U.S. Geological Survey.
John Wesley Powell, the second Director of the U.S. Geological Survey (USGS) from 1881 to 1894 and explorer of the Colorado River and Grand Canyon, recognized that water availability was a significant challenge in the western United States. During Powell’s USGS tenure, systematic inventorying of streams and their flows in the USA began in earnest.
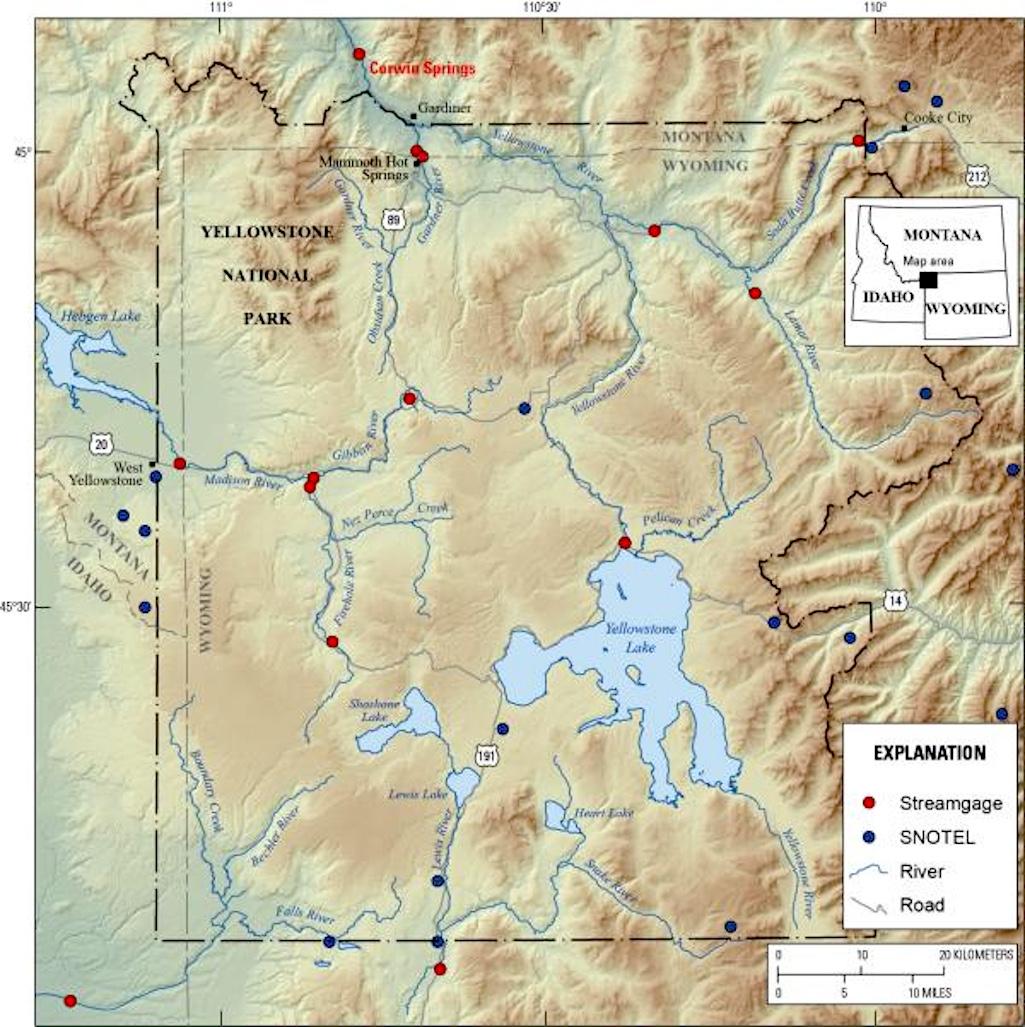
Map of SNOTEL snowpack telemetry sites (blue dots) and streamgages (red dots) in and around Yellowstone National Park. Corwin Springs streamgage site is labeled just north of the park boundary.
In January 1889, the first USGS streamgage was established along the Rio Grande near Embudo, New Mexico. Streamgages typically contain equipment to continuously measure the rate and volume of streamflow. Streamgages in the western USA are particularly challenging to install and maintain because the river stage (or height) and flow can vary greatly between the dry months (late summer-winter) and periods of snowmelt, and in many cases the riverbeds are soft and unstable. The equipment and techniques developed at the Embudo gage site became the foundation of USGS streamgaging methods. Since the establishment of the Embudo gage site, there has been a consistent increase in the number of established gages in the United States.
Currently, the U.S. Geological Survey measures discharge at approximately 8,500 sites across the United States. Most of the streamflow data are delivered in near real-time via the USGS National Water Dashboard (https://dashboard.waterdata.usgs.gov/app/nwd/en/?region=lower48&aoi=default). These flow data are used for planning, forecasting, and warning about floods and droughts; managing water rights and transboundary water issues; operating waterways for power production and navigation; monitoring environmental conditions to protect aquatic habitats; describing impacts to streamflow from changing land and water uses; assessing water quality and regulating pollutant discharges; determining if streams are safe for recreational activities; designing reservoirs, roads, bridges, drinking water and wastewater facilities; and many scientific investigations. Users of these data include water, utility, environmental, and transportation managers. More than 880 million requests for streamflow or water level information were fulfilled during the 2020 water year (which runs from October 1 to September 30 of the following year)!
There are currently 15 streamgages in and around Yellowstone that are used to monitor hydrothermal activity from the more than 10,000 thermal features, manage water supplies, and that are used to prepare for and investigate the impacts of floods.
While the Embudo streamgage site in New Mexico was the first USGS gage site, the gage on the Yellowstone River at Corwin Springs, just north of the national park boundary, is nearly as old! Daily average discharge at the site was first reported on August 1, 1889 and continued through October 31, 1893. Discharge measurements started again in 1910 and continue today. The discharge record at Yellowstone River at Corwin Springs is one of the longest in the United States! The hydrograph, which plots the level of stream flow over time, from the site appears to be saw-toothed, with the peaks generally representing higher flows in the spring as a result of snowmelt.
The highest instantaneous discharge measured at the Corwin Springs’ gage was during the June 2022 flood, when the maximum discharge was determined to be 54,700 cubic feet per second (CFS) (1,549 cubic meters per second), compared to a median peak during snowmelt of 12,000 CFS (340 cubic meters per second). The June 2022 flood is estimated to be a 500-year flood event, meaning that an event like this is likely to occur only once in 500 years.
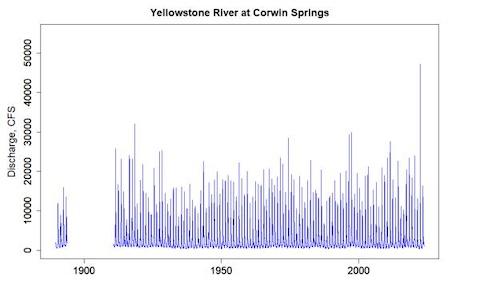
Hydrograph showing discharge in cubic feet per second for Corwin Springs streamgage site on the Yellowstone River, MT, spanning 1889-2023. The spike in 2022 is from the June floods of that year.
The gage house at Corwin Springs narrowly escaped serious damage from the 2022 flood, as the streambank about 164 feet (50 meters) downstream eroded away. However, the gage did not emerge completely unscathed. During the flood, monitoring equipment was washed away and the streambed changed its shape. In addition, the site continues to see changes to the bank and stream bed after the flood. During the 2023 spring high-flow runoff, a large unconsolidated sand and gravel bar migrated downstream and was deposited on top of the newly installed monitoring equipment at the gage! Approximately 2–3 feet (60–90 centimeters) of debris was deposited along the bank covering the piping that housed scientific monitoring equipment. The new gravel bar was probably deposited at the site on May 23, 2023, which corresponds to the highest flow in 2023, based on anomalous temperature and specific conductance measurements.
The gage house at Corwin Springs narrowly escaped serious damage from the 2022 flood, as the streambank about 164 feet (50 meters) downstream eroded away. However, the gage did not emerge completely unscathed. During the flood, monitoring equipment was washed away and the streambed changed its shape. In addition, the site continues to see changes to the bank and stream bed after the flood. During the 2023 spring high-flow runoff, a large unconsolidated sand and gravel bar migrated downstream and was deposited on top of the newly installed monitoring equipment at the gage! Approximately 2–3 feet (60–90 centimeters) of debris was deposited along the bank covering the piping that housed scientific monitoring equipment. The new gravel bar was probably deposited at the site on May 23, 2023, which corresponds to the highest flow in 2023, based on anomalous temperature and specific conductance measurements.

Streamgage site and profiling tool on the Yellowstone River at Corwin Springs, Montana. The gage house narrowly avoided damage during the June 2022 flood, which eroded the downstream bank. The river profiling instrument helps to map the river bottom to assess streamflow rates and conditions. USGS photo by Mike Poland, July 31, 2023.
Clearly the riverbeds and banks are still unstable as a result of the June 2022 flood! But the Corwin Spring gage keeps on measuring, continuing one of the longest continuous records of stream flow in the United States!